

Frequently Asked Questions
-
Where can I purchase blu® products?
blu® products can be purchased through our e-commerce partner, electrictobacconist.com, or in select retail stores which can be found by using our interactive Store Locator
-
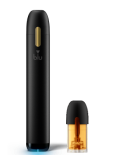
How do I charge the blu® Device?
Our e-cigarette batteries are shipped with a partial charge; however, for best performance with first time use, it is recommended that you fully charge the batteries before using them.
Complete the following steps:
- Remove your device and pod from packaging.
- Unfold the attached USB cord from the pack and plug it into a USB-compatible charging port.
- Connect the rechargeable device to the USB cord with the charging contacts properly aligned.
- Once your device begins charging, the red light on the end will glow and remain illuminated.
- When the indicator light turns off, your blu® is fully charged.
If the red-light blinks rapidly, remove the device for 10 seconds then re-connect the device to the USB cord. If the red light continues to blink rapidly, then the device is defective or has been depleted of its charge.
-
How does bluNation® Rewards work?
To become a Participant of the bluNation Rewards Program (the “Program”) you must be 21+ tobacco user and register on blu.com, where you may need to provide a US government ID to use for third party age verification purposes. Registration is free and can be completed on the blu.com website. You must certify that you are a smoker who is 21 years of age or older by accepting the Terms and Conditions.
The Program is open only to legal residents of the 50 United States, including the District of Columbia, who are smokers 21 years of age or older.
You can earn bluNation rewards points by participating in Program activities (i.e., surveys and polls) and entering claims codes from products. Participants will earn 1,000 Points upon joining the Program. A list of activities can be found on the bluNation Rewards page.
All blu products have a bluNation claims code printed on the inside of each pack. Each code may be entered one (1) time only. Participants can upload codes to add points to their bluNation online account. Participants can redeem their points for exclusive merchandise, e-Gift cards, and more, except where prohibited.